greenhouse gas

President announces new student working group on climate change!

Photo by Mark Mirko/Hartford Courant

This Tuesday, President Katsouleas announced the creation of a joint student-faculty working group to create “coordinated analysis, policy formulation and strategic planning on issues of sustainability, particularly reducing emissions.” In the announcement, which came via a campus-wide email, Katsouleas made an open call for applications from the student body, stressing that “diversity, including with respect to academic background, will be an important consideration.” The group will work for the remainder of the Fall semester and into the Spring to create a detailed action plan for the University.

The formation of this group comes in response to student demands from the Sept. 20th climate strike and subsequent sit-ins. Momentum for a student-led working group has been building since last semester, when UConn@COP24 fellows and Office of Sustainability interns discussed the idea with UConn’s Executive Vice President & CFO, months before President Katsouleas began his tenure as President on August 1st. The University Senate has played a key role, by endorsing the strikers’ demands and being continuous advocates for sustainability on campus. President Katsouleas has also agreed to convene a committee of the Board of Trustees, TAFS, to focus solely on coming up with recommendations for addressing the demands!

These are monumental steps in the right direction from the university administration. Not only is President Katsouleas committing to rapid forward momentum on the issue of sustainability, but he is also positioning students at the forefront of that effort.

All students who are interested can apply by sending a letter of interest and resume to president@uconn.edu. We strongly encourage all interested UConn students to apply!

The IPCC Report: Facing our Future

This October, the Intergovernmental Panel on Climate Change (IPCC) released a report that has shaken the global community. The IPCC was invited by the UN to report this year on the effects that we would experience if the global temperature warms 1.5℃ (2.7°F) above pre-industrial levels. They released a full report along with a technical summary and policymaker summary. The report contains scientific, technical, and socio-economic findings and has major ramifications across these disciplines. The contents of this report are grim, but give us a much more concrete vision of our future—something that is vital as the world makes plans to prevent catastrophic climate change.

Since civilization hit the industrial revolution in the mid-1800s, humanity has been dumping carbon dioxide and other greenhouse gases into the air at an exponential rate. This has led to an increasing amount of sunlight and heat being trapped in our atmosphere, and consequently an increase in our planet’s average temperature. Even a slight increase in this global temperature has immense impacts on our climate and in turn the survival of life on Earth, including humans.

The IPCC report begins by defining what exactly the average global temperature was before humanity started to affect it. The IPCC defines pre-industrial levels as the average global temperature over the period of 1850-1900. The report then talks about where we are now. We have already caused a 1℃ rise in the average global temperature compared to pre-industrial levels. Effects from climate change are already happening, and at this point they are inevitable.

However, we still have control over how severe these effects become, and how long they will last. On our current global trajectory, we will reach a 2℃ increase by 2040. With the passage of the Paris Climate Agreement, the world committed itself to changing this trajectory. Countries promised to keep the increase to under 2℃, and to strive to keep the increase near 1.5℃. In reality, the agreement has little binding power. Globally, we are struggling to reach the 2℃ goal, never mind 1.5℃, which is currently categorized as ‘above and beyond.’

The IPCC report focuses on the changes in our climate that will result if we curb the global temperature rise at 1.5℃ as compared to an increase of 2℃. Although any further rise in the global temperature has and will result in devastating changes to our natural and human systems, the difference between 1.5℃ and 2℃ warming is significant. This report makes it clear that 1.5℃ should not be considered as ‘above and beyond,’ but instead as the absolute limit for global temperature rise.

By 2100, the global average sea level rise is projected to be 0.1 meter lower at 1.5℃ than at 2℃. Sea level rise will continue past 2100, and it is inevitable at this stage. However, sticking to the 1.5℃ goal and slowing the rate of sea level rise will allow more time for adaptation of coastal communities impacted by this rise. Although 0.1 meters may not seem significant, it will make a big difference in giving the world time to prepare for sea level rise.

One of the most poignant symbols of this change in global temperature is the livelihood of the coral reefs. At 2℃, more than 99% of coral reefs will die off due to coral bleaching. At 1.5℃, only 70-90% of current coral reefs are projected to die off. The loss of this incredible phenomenon would be a tragedy. The majority of the ocean’s biodiversity exists in coral reefs, they serve as a buffer that protects coastlines from tropical storms, and they function as important primary producers as well.

The frequency of a sea-ice-free Arctic during summer is substantially lower at 1.5℃ than at 2℃. At 1.5℃, an ice-free summer will happen once per century; at 2℃, it will happen at least once per decade.

In addition to the effects mentioned previously, a 2℃ rise instead of 1.5℃ will drive the loss of coastal resources, reduce the productivity of fisheries and aquaculture, and lead to greater species loss and extinction. Vector-borne diseases, such a malaria and dengue fever, are expected to increase and shift geographic regions. A 2℃ rise will lead to larger net reductions of cereal crop yields such as maize, rice, and wheat.

As the global temperature warms, the effects outlined above are expected to lead to increased poverty and disadvantages in vulnerable populations. Limiting the temperature rise to 1.5℃ instead of 2℃ could reduce the number of people who will be susceptible to poverty and facing climate-related risks by up to several hundred million by 2050.

The IPCC states that reaching the 1.5℃ goal and protecting what we can of our world requires “upscaling and acceleration of far-reaching, multi-level and cross-sectoral climate mitigation and by both incremental and transformational adaptation.” While the Paris Climate Agreement was a historical step for humankind, it’s not nearly enough to save us. The agreement was the beginning of this world transformation; true change will require continued, tenacious, collaborative effort.

This information can be overwhelming and disheartening. We at the office understand that, and know that this work requires stubborn positivity. The only way we’re going to get close to reaching the 1.5℃ goal is if we wholeheartedly believe in our mission and in the future of our world. Even if we do not reach our goal of 1.5℃, or even that of 2℃, any change we make now will still have an important effect on generations to come. So get out there and make some change happen. Reduce your carbon footprint. Vote on November 6th. Start improving your community. Collaborate with friends and neighbors. Have meaningful conversations with those around you. We are each just one person, but we still have an important, irreplaceable influence on the world around us.

Link to the IPCC’s Report: http://www.ipcc.ch/report/sr15/

Clearing the Air – A look at UConn’s Greenhouse Gas Emissions

On March 25, 2008 University of Connecticut President, Michael Hogan, signed the American College & University Presidents Climate Commitment (PCC) promising that the university would aim for carbon neutrality by 2050. This means that the university would have to reduce greenhouse gas emissions, particularly carbon dioxide, through new projects and sustainable initiatives. Since the signing of this agreement, UConn has been retro-commissioning and re-lamping many large buildings to save on energy costs and negate greenhouse gas emissions. The university has also implemented an energy efficient fuel cell on the depot campus. So have we made progress?

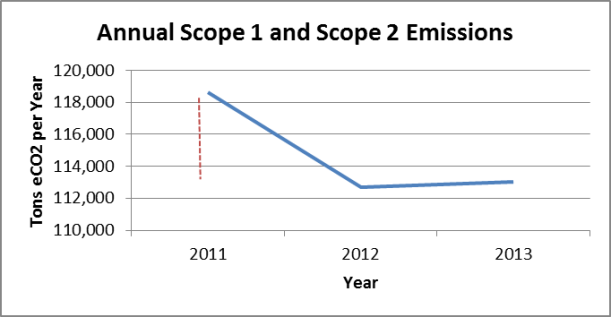
UConn has reduced its primary CO2 emissions by 4,802 tons per year since 2011 (more than 4%). This is a great decrease considering the increased student population, building space and tough winters (requiring a lot of energy consumption for heating) which Storrs has experienced over the past few years. It should also be noted that our emissions tracking technology and behavior has been improved over the past few years. We expect to see further drops in greenhouse gas emissions each year. To put our expected greenhouse gas emissions decreases into perspective, keep in mind that the retro-commissioning and re-lamping projects from the past few years have expected carbon dioxide offsets of 16,000 tons per year (This would cut out main body of emissions by more than 10%). Although we didn’t see the expected decrease in 2013 due to some  of the above factors, we believe that the general trend will continue to be downward.

GHG 2013 Graph

UConn uses the University of New Hampshire’s Campus Carbon Calculator to calculate emissions. Scope 1 refers to direct emissions from campus activity. Scope 2 refers to indirect emissions from purchasing and related activities.

The greenhouse gas inventory takes a very long time to complete because we have to contact various people from many different departments for emissions data. We put all of this data into common terms, verify it, and enter it into a large greenhouse gas calculator so that we can analyze our results. Let’s just say that we’re happy to be finished with this year’s greenhouse gas inventory, for now.

-Chris

LEED: Minimizing UConn’s Environmental Footprint

by OEP intern Emily McInerney

leedsilverOn March 25, 2008 President Hogan signed the American College and University Presidents Climate Commitment (ACUPCC). This pledge led way for UConn’s Climate Action Plan: a comprehensive outline that strategizes and maps out sustainability initiatives to help UConn reach its goal of carbon neutrality by 2050. Carbon neutrality is defined as proportional amounts of carbon released and carbon sequestered. This can be achieved through carbon offsets such as our Co-gen facility or something as simple as planting a tree. Realistically, however, carbon neutrality does not mean a zero carbon footprint. For UConn, the aim is to have the 2050 carbon emissions 86% below our 2007 levels. One of the very first initiatives implemented at UConn to lower GHG emissions was the adoption of our own Campus Sustainable Design Guidelines. These guidelines apply to both the construction of new buildings as well as the renovation of preexisting buildings.

The Sustainable Design and Construction Policy requires a LEED (Leadership in Energy and Environmental Design) silver certification as a minimum performance standard for all projects that exceed $5 million. The U.S. Green Building Council developed LEED to act as an international green building certification system. LEED buildings offer savings in water and energy, reduce GHG emissions, improve air quality to promote health safety for occupants, and lower operating costs.

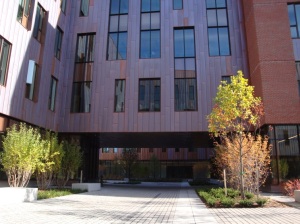
Oak Hall
Oak Hall

Most recently, the construction of two new buildings at UConn, Laurel and Oak Hall, have been completed that fulfill the LEED silver requirement. Oak Hall is set next to Homer Babbidge Library at the site of the former Co-op. Laurel is located where the Pharmacy building was originally constructed. These locations prevented the clearing of forests, wetlands, and other natural environments. There are several sustainable features that are important to note. From the outside, porous pavement reduces storm water runoff and flooding by providing storage and infiltration during storm events and a bio retention basin reduces harmful storm water runoff by collecting and holding storm water. The area is lined with native vegetation that provides habitat and food for local species. To reduce transportation CO2 emissions, biking is encouraged. There are 132 bicycle rack spaces available to facilitate bike transit.

Moving inside the building, the focus is on increased energy and water savings. The bathroom offers dual flush toilets and electric hand dryers to reduce paper waste. The combination of all water efficient features is anticipated to reduce water usage by 48%. The high performance windows both increase natural lighting which reduces energy costs and provide insulation through window glazing which reduce heating and cooling needs. Laurel is expected to have 16% energy savings and Oak is estimated to have 18% energy savings.

Visually speaking, LEED buildings are most notable for the recycled content and renewable materials that comprise their exterior paneling and interior walls and floors. Oak Hall uses bamboo for wall panels, recycled copper for the exterior siding and regional bricks. The bamboo is more sustainable than wood because it only take 3-5 years to harvest, the copper is made up of 80-95% recycled content, and the bricks are produced within 500 miles of campus. Approximately 75% of construction waste was diverted from landfills and reused or recycled.

Beyond sustainability, LEED buildings also have health benefits. Indoor environmental quality is improved through green cleaning products that are biodegradable, have low toxicity and low volatile organic compound content (VOC), and have reduced packaging. All plywood is formaldehyde-free and adhesives, sealants and paint have low or no VOC. Both Oak and Laurel are definite eye catchers. These buildings are not only environmentally friendly and cost effective but also aesthetically pleasing.  It is something to appreciate that sustainability can be characterized as modern and hip. For those interested in seeing how these LEED buildings affect UConn’s GHG emissions, the Office of Environmental Policy is planning to upload energy and water saving dashboards online.

Here are some examples of the sustainability features in Oak and Laurel Halls:

UConn’s Greenhouse Gas Inventory: Taking Stock of our Climate Progress and My Last Two Years

In my two years as a Sustainability Intern with the Office of Environmental Policy, I have been placed in a very interesting role. I have compiled the three greenhouse gas emission inventories for the Storrs campus from 2009 up though last year, 2011. This task has proven to be something I can look back on and be proud of and something that I think the University can also look back on and be proud of.

History and Purpose

The greenhouse gas inventory documents all the sources of emissions from the University that contribute to global warming, such as carbon dioxide, methane, nitrous oxide, and many others. The University has voluntarily tracking this information to some degree since 2003 although thorough inventories did not begin until 2007.

In 2008, then President Michael Hogan made the University a signatory of the American College and University Presidents’ Climate Commitment (PCC) at the request of large student support. The PCC is a pledge by institutions of higher education to reach a goal of climate neutrality by the year 2050. Signatories must have submitted an outline of how they would reduce their emissions to the 2050 target in a document known as a Climate Action Plan in order to become a part of the PCC. Additionally, participating institutions must provide annual greenhouse gas inventories and biannual progress updates.

Making Progress

In general our largest source of emissions each year has been from on campus stationary sources such as the cogeneration plant (which supplies most of the Storrs campus with electricity and steam), boilers (to produce additional steam for heating), chillers (which produce chilled water for cooling buildings), and generators (for emergency power). In fact, going back to 2001, this source of emissions has never accounted for less than 75% of the total campus emissions.

[/caption]This indicates that decreasing the demand for electricty, steam, and chilled water on campus is worthwhile strategy for reducing the amount of emissions generated each year.

The University of Connecticut has gone to great lengths to make its buildings significantly more energy efficient over the last few years. Some of the energy-saving initiatives have included replacement of lighting fixtures and bulbs, the annual EcoMadness energy conservation competition, and the sustainable design and construction guidelines.

Dot-plot with a moving average showing the amount of energy emissions per student for the years 2001 through 2010.
In 2010, 77% of emissions come from either fuel burnt at the cogeneration plant or from stationary sources like generators and chillers.The above graph shows that over time UConn has been able to produce less greenhouse gas emissions on a per student basis over the years. This is especially amazing considering that the student population at UConn has grown by nearly 40% over that time and campus building space has grown by just over 30%. One key to this success has included the construction of the cogeneration system in the central utility plant, which provides UConn with electricity and steam in a more efficient manner than the grid can. Another has been the University’s policy requiring major construction and renovation projects since 2008 to meet a minimum LEED Silver rating, such as the Burton-Schenkman football training complex.
The University also has small emission contributions from other categories like transportation, fertilizer application, and refrigerants (which are actually incredibly potent greenhouse gases). Some of the emissions are offset by the UConn forest and its new composting operation.

[caption id="" align="aligncenter" width="481"]A dot-plot showing the emissions from 2007 through 2010. A line has been fitted over the past four years’ data to approximate the trend in how UConn’s emissions have been going.

Form 2007 to 2010, the overall emissions dropped by about 6,000 MT eCO2 per year, which is the equivalent of taking about 120 passenger cars off the road each of those years. This is a 3% annual decline.

This is a promising trend considering the fact that the number of full-time students increased 6% over those three years, part-time students by 10%, and summer students by 68%. Although there was a significant drop in building space from 2007 to 2008, building space increased from 2008 to 2010 increased by 3.5%.

Summing It All Up

Working on the greenhouse gas inventory has been immensely rewarding. I personally worked on the greenhouse gas inventories as far back as 2008 and I was the primary intern who worked on the 2009-2011 inventories. Not only am I proud to see my work produce these useful metrics for evaluating our steps towards sustainability, but I am also proud to have been a part of something that connects so much of the University together.

For each inventory I had to contact tens of people for information on a huge variety of sources. I received data from sources involved in generating power on campus as well as sources involved in generating compost (which now includes the agricultural compost facility, the floriculture program, many of the campus dining halls, the Spring Valley Farm living and learning community, and the EcoGarden student group). There is just something incredibly exciting to take bits and pieces from so many staff and faculty members and then have the opportunity to show them how their contribution to campus sustainability fits in at our annual spring Environmental Policy Advisory Council (EPAC) meeting.

I am excited that in less than one month I can honestly tell them that our University has reduced its emissions by 9% in three years, even as campus and the student body grew. And most exciting is that the 2011 inventory is nearing completion and it is so far promising our largest reduction to date.

Even when I felt things were not working in favor of sustainability on campus, I could still look at the inventory and know that the University has made and is still making a great and concerted effort to reducing our environmental footprint — and I would hope everyone can see this as well. (We did after all finish 16th in the Sierra Club Cool Schools survey last year, in part thanks to our third best overall score of 9.5/10 in energy efficiency — so even if we accidentally leave a few lights on, rest assured that we’ve done our best to make them “waste” as little energy as possible.)

So ultimately I would remind everyone, as an outgoing intern and as a graduating senior, that you must not let good be the enemy of perfection; take time to appreciate your progress every so often. But likewise, do not rest on your laurels, especially when you have shown in the past just how much you can accomplish.

Written by…

Chris Berthiaume is a senior in Environmental Engineering and a second year intern with the OEP. His major projects have included the greenhouse gas inventory, updating the website, social media engagement, and the assisting with the 2012 EocHusky 5k.