The University began conducting an inventory of all the greenhouse gas emissions from the Storrs campus in 2003. Incomplete inventories exist dating back to 1996 as well as an additional inventory for 1990. The inventories provide the University with concrete data for evaluating its progress towards a more sustainable campus. The ACUPCC, signed in 2008, has given the University the goal of becoming a climate neutral campus by 2050, with numerous intermittent goals. Since then, starting with the 2007 greenhouse gas inventory, comprehensive and consistent inventories have been compiled.
Here you can find some graphs and explanations of emission sources over the last few years.
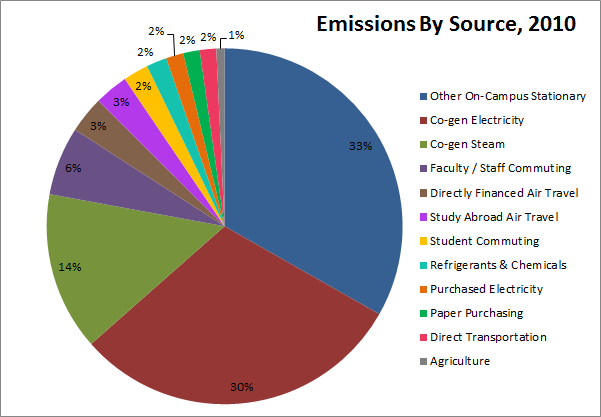
The sources of emissions in 2010 were primarily from on campus stationary sources. In fact, going back to 2001, there has never been a year where energy-related emissions did not contribute at least 75% of the total emissions. This indicates that decreasing the demand for electricty, steam, and chilled water on campus is worthwhile strategy for reducing the amount of emissions generated each year.
The University of Connecticut has gone to great lengths to make its buildings significantly more energy efficient over the last few years. There are numerous energy saving initiatives underway and even completed, including the adoption of sustainable design and construction policy which requires major construction and renovation projects to meet at least LEED Silver certification, replacement of lighting fixtures and bulbs with more efficient technology, a retrocommissioning project to optimize temperature and lighting controls in a third of the campus building space, and encouragement of behavioral changes by students through programs like the annual EcoMadness energy and water competition. One of the most significant additions to UConn’s energy efficiency is its cogeneration plant, which can harvest significantly more energy from its fuel than a similar conventional power plant.
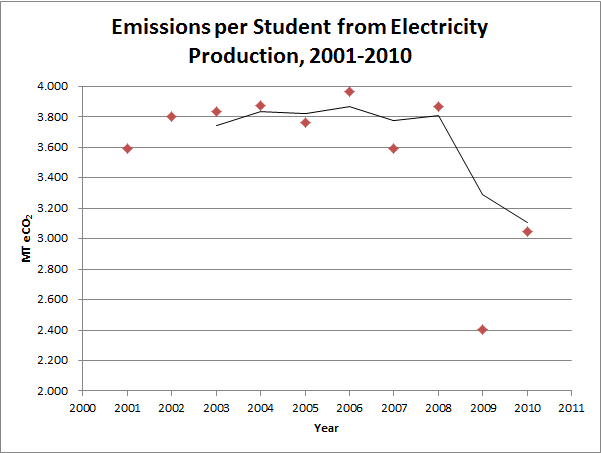
This graph shows the amount of greenhouse gases produced by the Storrs campus of UConn normalized by the number of full-time students attending the campus. A three year moving average has been added as a trendline to remove some of the noise of year-to-year variability. The amount of emissions is measured as metric tons of carbon dioxide equivalent (MT eCO2), which includes various other greenhouse gases like methane, nitrous oxide, and others. For reference, the average passenger car produces 5 MT eCO2 per year according to the EPA.
The co-generation plant began production in 2006. In that year, it was still being fine-tuned for efficiency and some electricity was still being purchased from the grid. Beginning in 2007, some per capita emission reductions were being observed. More significant per capita emission reductions can be seen in 2009 and 2010, which followed the relamping initiative as well as the construction of the Burton-Schenkman facility, which is LEED Silver certified.
Additional sources of emissions being accounted for include various transportation, travel,and commuting categories; agricultural categories such as fertilizer application and compost production; solid waste and wastewater production; and purchasing categories such as paper and refrigerants. The University also has a source of offsets in the form of its forests. The forests help sequester carbon dioxide from the atmosphere, however these reductions are dwarfed by the amount of emissions produced by the Storrs campus at present.
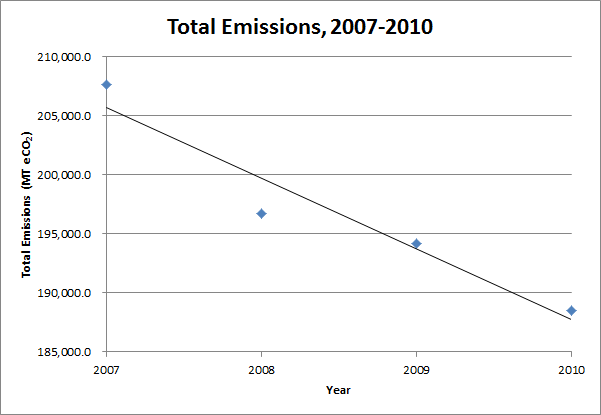
Overall, emissions over the last four years have been steadily decreasing. (Emissions totals from previous years are not being shown because complete and consistent emissions tracking began with the 2007 inventory.) The decline has been at a rate of about 6,000 MT eCO2 per year, which is just over a 3% annual decline.
This decline has occured even as the number of full-time students has increased by 6% over the three years, part-time students have increased by 10% and summer students by 65%. And while these three years saw an overall 6% decrease in building space, declines in emissions have still been observed from 2008 to 2010, when building space increased by 3.5%.
This decline in emissions contrary to growths in the student body and building space are positive indicators that UConn will continue to cut its climate footprint, even as it expands into a bigger and better institution in the years to come. With the Climate Action Plan leading the way, UConn can be seen as an innovator and leader in the realm of sustainability.